Interactive Canada map for WordPress (Carte interactive du Canada). Map has customised tooltip. First of all- ensure that “Use Html Tooltip” is checked. Google geochart api automatically generates tooltip with following Html structure:
<div class=”google-visualization-tooltip”>
<ul class=”google-visualization-tooltip-item-list”>
<li class=”google-visualization-tooltip-item”><span>Tooltip Title</span></li>
<li class=”google-visualization-tooltip-item”>Tooltip main text</li>
</ul>
</div>
The plugin generates each map in div block with id = gm{maps current id}_visb (for ex. gm1_visb, gm99_visb etc). So if you plan to use multiple maps, you can customize tooltip with specifying maps id
#gm18_visb .google-visualization-tooltip {}

#gm18_visb ul.google-visualization-tooltip-item-list { }

#gm18_visb .google-visualization-tooltip-item { }

#gm18_visb .google-visualization-tooltip-item span {}

#gm18_visb .google-visualization-tooltip-item:nth-child(2) {}
In current example, I used following demo CSS rules.
#gm18_visb .google-visualization-tooltip {

background: lightpink;

border-radius: 10px;

border: 1px solid red;

overflow: hidden;

}
#gm18_visb ul.google-visualization-tooltip-item-list {
background: lightseagreen;
}
#gm18_visb .google-visualization-tooltip-item { /*you can use here also .google-visualization-tooltip > ul > li or can customise first child only .google-visualization-tooltip > ul > li:first-child*/
background: darkred;
margin: 0px;
padding: 0px;
text-align: center;
width: 100px;
word-wrap: break-word;
}
#gm18_visb .google-visualization-tooltip-item span {
background: deeppink;
color: #FFFFFF ! important;
text-transform: uppercase;
}
#gm18_visb .google-visualization-tooltip-item:nth-child(2) {
background: lightgoldenrodyellow;
}
Enable color by value is checked – to show maps regions colors based on each region some value. (from Min color value to Max color value).
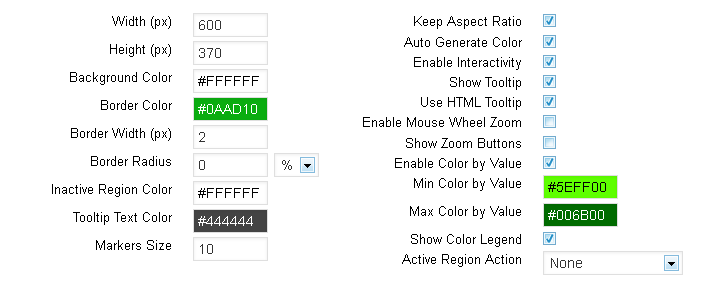
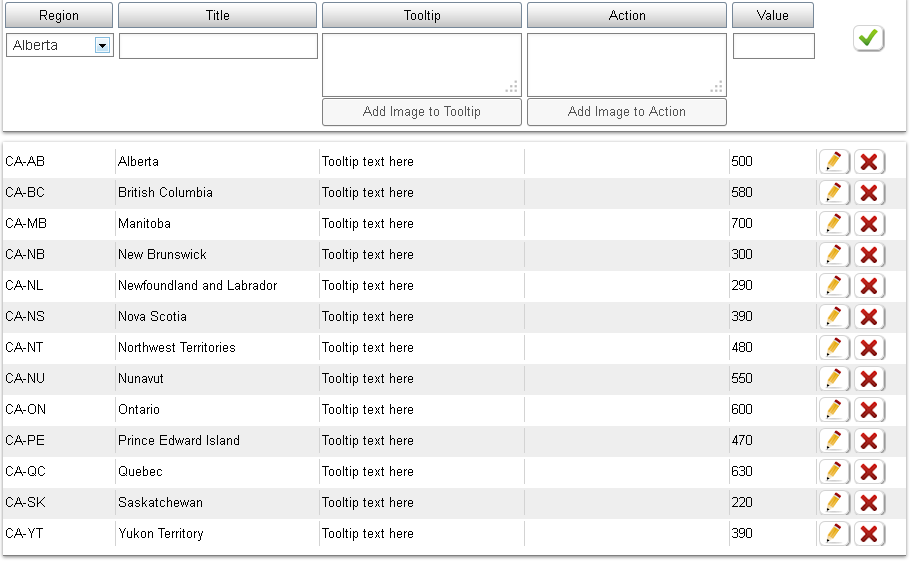
For each region we can specify any value.
This demo map is created with Google Interactive Maps WordPress plugin, which lets you create unlimited responsive interactive maps (Interactive World Maps, Europe Interactive Maps, Interactive US Maps, Africa Interactive Maps, Germany Interactive Maps, Interactive Maps of Canada and map of any other continent, country and US state).
Each map can be used multiple times in different posts and pages. Active data is shown in two ways: as fully colored Region, or Marker with colored bubble. Each active region can have: Tooltip on hover and an Action on click. Both tooltip and action values can have HTML text and images.
Plugin is based on Google GeoChart API, all necessary country and province data is included. Plugin enables to Zoom maps with mouse scroll and drag them. It creates SVG maps (No Flash).